Transform your data into actionable insights with an automated and interactive Tableau dashboard! Using your clean data source, I'll craft a dynamic front-end that enables effortless exploration and analysis. I am proficient in the following types of data analysis and much more:
- Time Series Analysis: Track trends over time with line charts, area charts, or time series forecasts.
- Comparative Analysis: Compare metrics using bar charts, stacked bar charts, or side-by-side comparison charts.
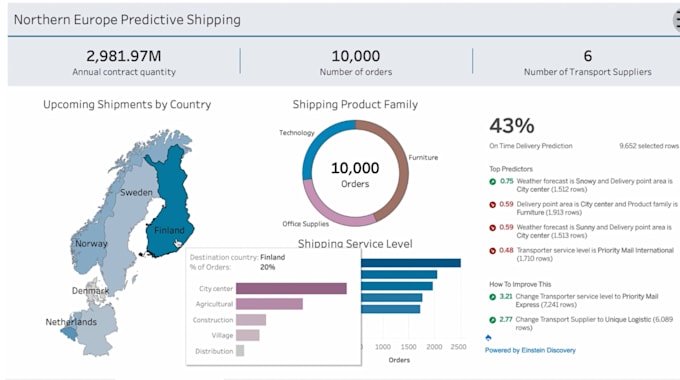
- Geospatial Analysis: Visualize data on maps using point maps, filled maps, or heat maps to identify geographic trends.
- Trend Analysis: Show trends and patterns using scatter plots, trend lines, or bubble charts.
- Distribution Analysis: Display data distributions with histograms, box plots, or violin plots.
- Correlation Analysis: Explore relationships between variables using correlation matrices, scatter plot matrices, or correlation heat maps.
- Forecasting and Predictive Modeling: Utilize forecasting techniques like exponential smoothing or ARIMA models to predict future trends.
- Hierarchical Analysis: Drill down into hierarchical data structures using tree maps, sunburst charts, or nested pie charts.