Sembra che questo servizio sia in sospeso

I will create your data analysis visualization using python as your data analyst

A
aadataanalysis
A
aadataanalysis
Ahmed A
Alcune informazioni sono riportate in lingua inglese.

Informazioni su questo servizio

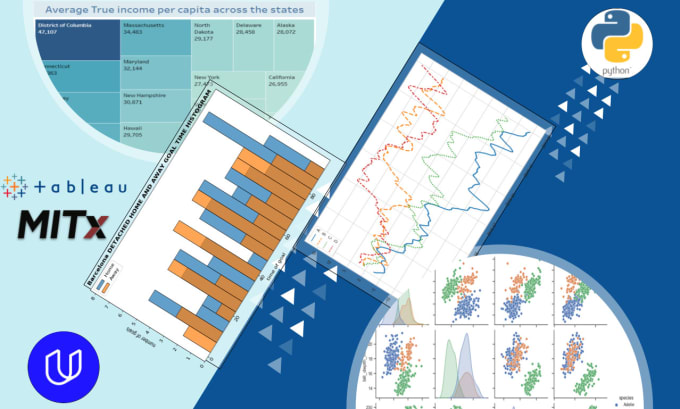
Data Visualization Expert Using Python

I will create stunning data visualizations for you using Python, Matplotlib, and Seaborn. These libraries allow me to make customized data visualizations that bring your data to life.

What I can offer:

  • Line charts, bar charts, scatter plots, box plots, histograms, heatmaps, word clouds, etc. to visualize your data
  • Customize the visuals to match your brand colors and style
  • Add titles, labels, highlights, annotations, etc. to make the charts easy to understand
  • Optimize the charts for viewing on screens and for print
  • Explain the key insights and story shown in the visualizations
  • Source data cleaning and preprocessing if required

Let me take your data and turn it into clear and impactful visual stories. I can visualize data from a variety of sources including CSV files, SQL databases, Excel files, and JSON.

Scopri di più su Ahmed A

Ahmed A
5,0(1)
  • DaEgitto
  • Membro damag 2023
  • Ultima consegna2 anni
  • Lingue

    Inglese, Arabo, Tedesco
Data Analytics and Machine Learning professional with deep expertise in statistical modeling, predictive analysis, and pattern recognition.A top graduate of Udacity's Advanced NanoDegree. Certified in machine learning (MITx).Applied skills extensively through +10 practical data science projects including medical no-shows, A/B tests, soccer top 5 leagues, and demographic data analysis. Experienced in developing customized solutions leveraging tools like Python, SQL, Tableau, and machine learning libraries. Solid mathematics, with a lifelong passion for using data to solve real-world problems.