Sfoglia categorie
Esplora
Fiverr Pro
Italiano
$
USD
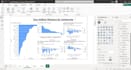
Hai dei dati ma non sai come interpretarli? Ti aiuterò a trasformare i tuoi numeri grezzi in dashboard Power BI chiare e approfondite, che hanno un significato concreto per la tua azienda.
Che tu voglia monitorare vendite, spedizioni, performance dei prodotti o trend regionali, ho la soluzione che fa per te. Ho lavorato a progetti concreti che hanno aiutato le aziende a comprendere i propri dati e a prendere decisioni più consapevoli.
Cosa posso offrire :
Opzioni del pacchetto:
Se cerchi chiarezza, velocità e immagini pulite che aiutino davvero la tua attività, lavoriamo insieme.
Diamo vita ai tuoi dati!


Traduzione automatica.
Di cosa ho bisogno per iniziare?
Condividi semplicemente il tuo set di dati (Excel, CSV o qualsiasi altro formato) insieme a una breve spiegazione di ciò che vorresti vedere o analizzare. Se hai dubbi, ti guiderò passo passo.
Non ho dati puliti. Puoi aiutarmi con questo?
Sì! Offro servizi di base di pulizia e trasformazione dei dati come parte dei pacchetti Standard e Premium. Se i tuoi dati necessitano di più lavoro, possiamo discuterne come servizio extra.
Il dashboard sarà interattivo?
Assolutamente sì. Tutte le dashboard includono slicer, filtri e elementi visivi su cui è possibile cliccare per esplorare i dati.
Posso richiedere elementi visivi o KPI specifici?
Certamente. Fammi sapere quali informazioni stai cercando, che si tratti di trend di vendita, performance del prodotto o altro, e adatterò la dashboard in base a ciò.
Cosa succede se ho bisogno di modifiche dopo la consegna?
Offro revisioni per ogni pacchetto. Sono felice di apportare aggiornamenti affinché la dashboard finale si adatti perfettamente alle tue esigenze.


