Sfoglia categorie
Esplora
Fiverr Pro
Italiano
$
USD
Data Scientist
Got a messy spreadsheet and no idea what it's telling you? I turn raw CSV/Excel data into clear insights, charts, and business recommendations using Python (Pandas, NumPy, Matplotlib, Seaborn).
WHAT YOU GET:
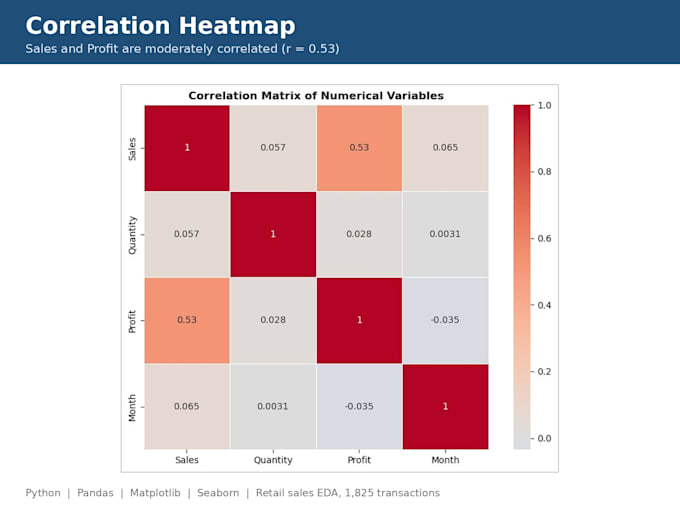
REAL EXAMPLE: I analyzed 1,825 retail transactions ($1.78M in sales) and found the top category, best region, peak sales month, best day to run promotions, and a 25.4% profit margin, then turned it into clear business actions.
PERFECT FOR: small businesses, e-commerce sellers, startups, students, researchers.
WHY ME:
Message me before ordering with your dataset and goals. I'll confirm the scope for free!


What type of data files can you analyze?
I can analyze CSV,Excel and JSON datasets,depending on the size and requirements.
Do you use Python for data analysis?
Yes.i use python with pandas,numpy,matplotlib and seaborn for data analysis and visualization
Can you clean messy or missing data?
Yes.Depending on the package,i can handle missing values,data types,duplicates,text cleaning,sorting,filtering and other processing tasks.
Can you perform explooratory data analysis(EDA)?
Yes.EDA can include descriptive statistics,distributions,outlier detection,correlation analysis and visual exploration.
Can you create data visualizations?
Yes.i can create bar charts,line plots,scatter plots,histogram,distribution plots,categorical charts and heatmaps.
Will you provide a report?
A written summary or EDA reports is available in the standard and premium packages.
Can you analyze a large dataset?
Please contact me first with the approximate file size,number of rows&columns and your required analysis.
Can you handle a custom python data analysis project?
Yes.if the project fits my listed python,pandas,numpy and visualization skills.please contact me before ordering.