Sfoglia categorie
Esplora
Fiverr Pro
Italiano
$
USD


_myszn8.jpg)
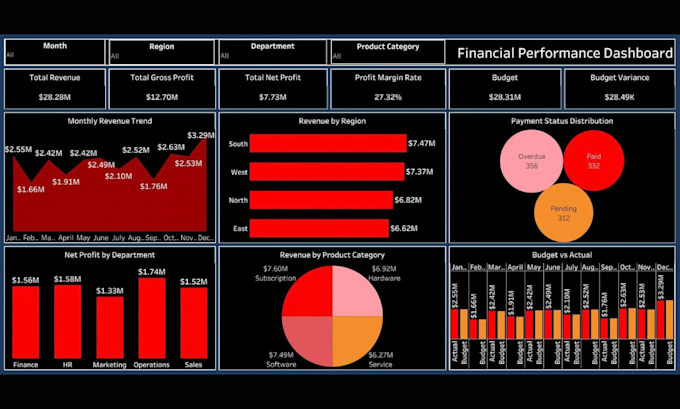
Looking for a professional Tableau Dashboard that turns your data into clear and useful insights?
I can create a clean Tableau Dashboard tailored to your business or project needs. Whether you need Data Visualization, interactive Charts, or clear Reporting, I can transform your raw data into an easy-to-understand dashboard.
My Tableau Dashboard service includes:
I focus on meaningful Data Visualization rather than unnecessary visuals. Your Tableau Dashboard will highlight the KPIs and insights that matter most.
I can create dashboards for Sales, Financial, Healthcare, Operations, HR, and other business data based on your requirements.
You will receive a professional Tableau Dashboard, clear Data Visualization, useful Charts, and organized Reporting.
Send me your dataset and requirements to get started.
Professional Data Analyst and Power BI Tableau Excel Dashboard Expert
Lingue
What do you need from me to create a Tableau Dashboard?
I usually need your dataset and a brief explanation of your goals, KPIs, or preferred Reporting requirements. If you already have a specific design or reference, you can share that as well.
What type of Tableau Dashboard can you create?
I can create professional Tableau Dashboard solutions for sales, financial, healthcare, operations, HR, and other business data, depending on your requirements.
Can you create interactive Data Visualization and Charts?
Yes. I can create clear and interactive Data Visualization using relevant Charts, KPIs, filters, trends, comparisons, and other Tableau features to make your data easier to understand.
Can you work with my existing Tableau Dashboard?
Yes. I can help improve the layout, Charts, Data Visualization, calculations, formatting, and overall usability of an existing Tableau Dashboard, depending on the project requirements.
Will the Tableau Dashboard include Reporting and insights?
Yes. I can structure the Reporting so that important KPIs, trends, and comparisons are presented clearly. The goal is to make your Tableau Dashboard useful for understanding performance and supporting better decisions.