Sfoglia categorie
Esplora
Fiverr Pro
Italiano
$
USD

Traduzione automatica.
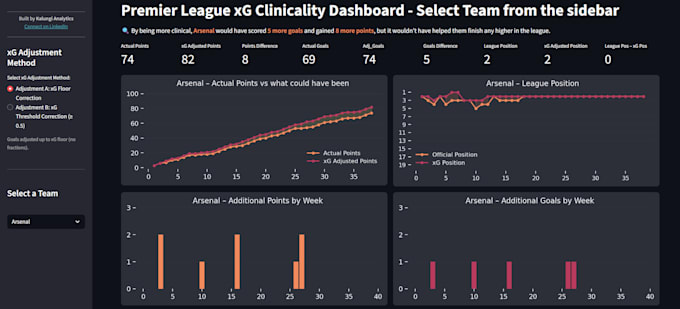
Hai bisogno di una dashboard personalizzata e interattiva senza i costi di Power BI o Tableau?
Progetterò e costruirò una dashboard Streamlit su misura per le tue esigenze. Che si tratti di KPI aziendali, esplorazione dei dati, report finanziari o visualizzazione di ricerche, trasformerò i tuoi dati in un'app web pulita e interattiva.
Ciò che otterrai:
Una dashboard Streamlit personalizzata (basata su Python, leggera e interattiva)
Design pulito con layout intuitivi
Supporto per la tua fonte di dati (CSV, Excel, SQL, API)
Opzioni di hosting spiegate chiaramente:
Perché scegliere me?
Data Analyst Excel, Power BI, Looker Studio and Python Solutions
Lingue
Traduzione automatica.
Traduzione automatica.
Cos'è Streamlit e perché dovrei sceglierlo?
Streamlit è un framework leggero in Python per creare dashboard interattive e app web. È veloce, flessibile e ideale per esplorazione dei dati, monitoraggio KPI o report personalizzati. A differenza di strumenti pesanti come Power BI o Tableau, Streamlit permette layout completamente personalizzati con Python.
Posso condividere la mia dashboard online?
Sì! Le dashboard possono essere ospitate: Streamlit Cloud gratuito: ottimo per demo/prototipi, ma l'app si mette in sleep dopo 15 minuti di inattività. Hosting a pagamento (Render, Heroku, Railway, ecc.): mantiene la dashboard attiva 24/7 — i costi di hosting si applicano (~20$/mese). Oppure posso consegnare il codice completo al tuo team IT per l'hosting interno.
Quali fonti di dati puoi usare?
Streamlit supporta Excel, CSV, database SQL, API e altre fonti web. Ti aiuterò a collegare i tuoi dati alla dashboard in modo che sia interattiva e precisa.
La dashboard può aggiornarsi automaticamente?
Aggiornamenti automatici sono possibili se ospitati su piattaforme cloud come Render o Heroku. Streamlit Cloud gratuito non supporta aggiornamenti continui in tempo reale — si aggiorna solo quando l'app viene caricata.
Potrò modificare la dashboard in un secondo momento?
Assolutamente! Fornisco il codice Python completo e le istruzioni, così puoi modificare o espandere la dashboard in futuro.
Cosa succede se in seguito ho bisogno di funzionalità o pagine aggiuntive?
Nessun problema — offro offerte personalizzate per progetti più grandi, funzionalità avanzate, dashboard multi-pagina o integrazione con più fonti di dati.