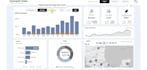
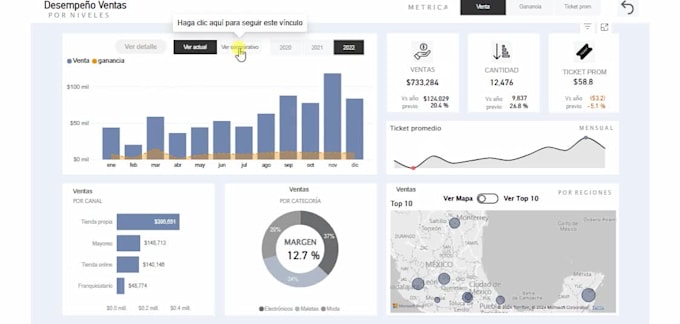
Visualizzazione e reporting dei dati usando Power BI
- Estrazione e trasformazione dei dati da qualsiasi fonte compatibile con Power BI (Excel, CSV, SQL, Access, ecc.) tramite processi ETL.
- Ottimizzazione nella creazione e nell'elaborazione dei dati con Power Query per generare un modello di dati efficiente e ad alte prestazioni.
- Costruzione di metriche avanzate per analisi più approfondite e dettagliate.
- Utilizzo di funzioni DAX avanzate per eseguire calcoli complessi e analisi dettagliate.
- Sviluppo di visualizzazioni interattive come grafici, mappe e report dettagliati, applicando le migliori pratiche e raccomandazioni di Microsoft.
- Implementazione di funzionalità avanzate come tooltip personalizzati e drillthrough per una navigazione e analisi dei dati più approfondite.
- Sviluppo di dashboard e report professionali con visualizzazioni di dati di impatto, inclusi filtri personalizzati per migliorare l'esperienza utente.
Comunicazione diretta e chiara per garantire che ogni progetto soddisfi le tue aspettative.
Contattami prima di effettuare un ordine per discutere i dettagli e personalizzare il tuo progetto.