Sfoglia categorie
Esplora
Fiverr Pro
Italiano
$
USD

*Please connect with me before placing an order to avoid misconception*
We can not deny the fact that visual things are easier to grasp and analyze. Data Visualization helps us to grasp and analyze the data more easily and will help you to make better and faster decisions. It will help you to find new and hidden patterns to understand difficult patterns.
That's where I come in...
I am a skilled data analyst who specialises at Tableau data visualisation. I create beautiful, bespoke dashboards to suit any requirement.
I can express your data accurately and simply by using a range of charts and colours to visualise it in many different ways.
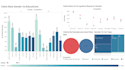
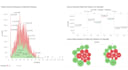
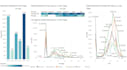
The kind of Visuals I create;
What you will get:
Your satisfaction is my priority!
Thank you,
Indresh.
Lingue
Do I need to provide data?
Yes, you need to provide the data in proper format in Excel or CSV.
What should I do if I don't have data in correct format?
You can opt for Data preparation service as well. I prepare data for you and visualize it. Ping me for more details on this.
Will I get an explaination on how the data is visualized and what are the insights from the visuals?
Yes, if you require a explaination session at the end of product delivery, we can have one. Do ping me for more details.


