Sfoglia categorie
Esplora
Fiverr Pro
Italiano
$
USD



Traduzione automatica.
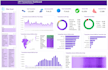
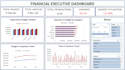
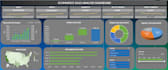
Creo dashboard interattivi in Excel alimentati da pivot table, grafici pivot e slicer che trasformano fogli di calcolo disordinati in storie visive chiare. Vendite, marketing, finanza, inventario, HR, qualunque cosa tu voglia monitorare, la rendo visibile a colpo d'occhio.
Ciò che ottieni:
Perché lavorare con me: progetto dashboard in base alle tue decisioni, a ciò che devi vedere, confrontare e su cui agire.
Come lavoriamo:
Scrivimi con i tuoi dati, rendiamo i tuoi numeri facili da vedere.
Civil Engineer, Power BI Excel Dashboards, Construction Project Data Specialist
Lingue
Traduzione automatica.
Traduzione automatica.
Posso aggiornare la dashboard con nuovi dati da solo?
Sì. Aggiungi nuove righe al tuo foglio dati, clicca su aggiorna e le tabelle pivot e la dashboard si aggiornano automaticamente.
Cosa succede se i miei dati sono disordinati o contengono errori?
È esattamente quello che faccio prima. Rimuovo i duplicati, correggo le formule rotte, standardizzo il formato e solo dopo costruisco la tua dashboard — numeri precisi, sempre.


