Sfoglia categorie
Esplora
Fiverr Pro
Italiano
$
USD


Traduzione automatica.
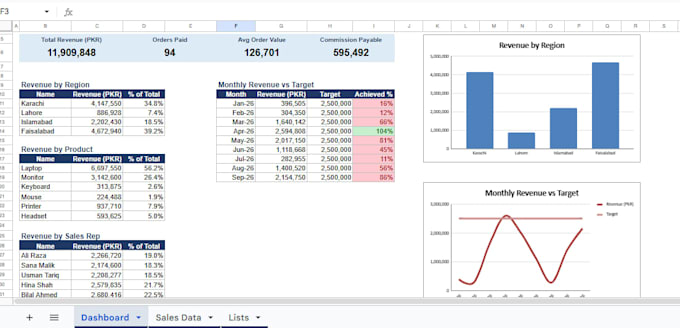
Hai bisogno di una dashboard in Excel pulita e facile da leggere? Trasformo i tuoi dati grezzi in una dashboard chiara e professionale con KPI, grafici e tabelle riepilogative.
Ciò che ottieni:
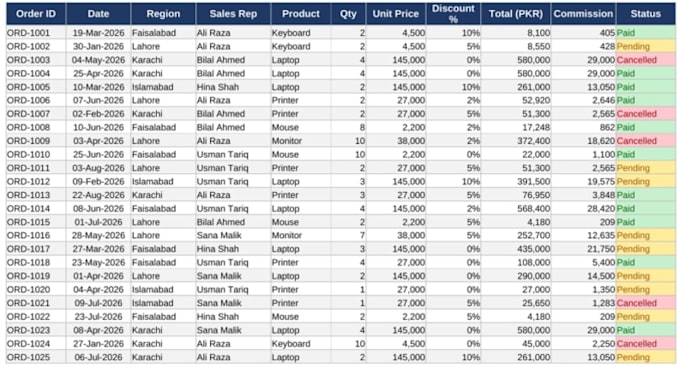
Posso anche pulire dati disordinati, riparare formule rotte e combinare più fogli in un unico report.
Come funziona:
Prima di iniziare, condividi il tuo file in formato Excel o CSV. Scrivimi prima se hai esigenze personalizzate, così posso confermare se posso farlo.
Excel Dashboard,Formulas and Data Cleaning Expert
Lingue
Traduzione automatica.
Traduzione automatica.
Quale software usi?
Costruisco dashboard in Microsoft Excel. Posso lavorare anche in Google Sheets per progetti semplici.
Quanto tempo ci vorrà per la consegna?
Il pacchetto basic richiede 2 giorni, lo standard 4 giorni e il premium 6 giorni, a seconda delle dimensioni dei tuoi dati. Se hai bisogno più velocemente, scrivimi prima.
Cosa devo mandarti?
Per favore, inviami i tuoi dati in un file Excel o CSV e dimmi quali numeri sono più importanti per te. Più chiare sono le tue richieste, migliore sarà il risultato.
Il dashboard si aggiornerà quando aggiungo nuovi dati?
Sì. Uso formule, quindi i riepiloghi e i grafici si aggiornano quando aggiungi nuove righe nello stesso formato. Includo anche una breve guida su come aggiornarlo.
Puoi riparare o pulire il mio lenzuolo attuale?
Sì, posso pulire dati disordinati e riparare formule rotte. Scrivimi prima un esempio del tuo file così posso confermare il lavoro prima di ordinare.