Sfoglia categorie
Esplora
Fiverr Pro
Italiano
$
USD

Data Insights And Analytics
Competenze
Consulta i miei servizi
Data analysis
DATA • Freelance
May 2025 - Present • 1 yr 1 mo
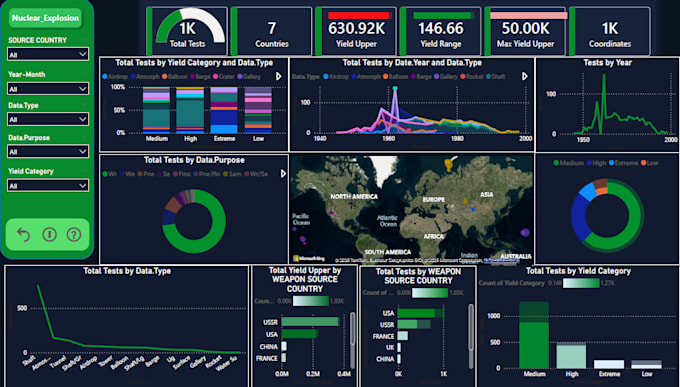
I am a professional data analyst and dashboard designer specializing in turning raw data into clear, actionable insights. I work as a freelancer on Fiverr and other platforms. 【Skills】 - Python (data cleaning, analysis, visualization, automation, Folium for maps) - n8n (automation workflows, API integrations, data pipelines) - Excel / Google Sheets (advanced formulas, pivot tables, dashboards, MOS Expert level) - Power BI (interactive dashboards, DAX, data modeling, PL‑300 ready) - Data visualization design (clean, business‑friendly, interactive filters) 【Three Real Dashboards I Have Built】 1. Sales & Profit Dashboard (E‑commerce / Retail) KPIs: Total Sales 2.30M, Profit 286.24K, Discount 1.56K, Profit Ratio 0.12 Breakdowns: Region (West, East, Central, South), Customer Segment (Consumer, Corporate, Home Office), Shipping Mode (Standard, Second Class, First Class), Product Category (Technology, Furniture, Office Supplies) Result: Helped client increase profit by 18% in two months and save 10 hours/week of reporting time. 2. Billionaire Wealth Analysis Dashboard KPIs: Total billionaires count (72), average age (~88), average wealth (24B), female billionaires (7) Charts: Wealth categories (5B-20B, 20B-50B, 50B+), top cities by billions (NY, LA, SF, Chicago, etc.), industry pie chart (Finance, Fashion & Retail, Tech, Energy, etc.) Filters: Industry, country, gender, self‑made, wealth category Result: Automated weekly reports using n8n + Python, saved client 6 hours/week of manual work. 3. Nuclear Explosion Tests Dashboard (Historical & Geospatial) KPIs: Total tests (~2000), number of countries (7), max yield (661.74 kt), yield range, coordinates Map: World map with exact test locations (Pacific Ocean, North America, Asia, etc.) Classifications: By yield category (Low/Medium/High/Extreme), test type (Airdrop, Atmospheric, Balloon, Barge, Crater, Gallery, Mine), purpose (Weapon development, Peaceful, Safety, Military)
