Creerò visualizzazione dei dati di vendita usando Power BI

M
misturaganiyu
M
misturaganiyu
Mistura Ganiyu
Alcune informazioni sono state tradotte automaticamente.

Informazioni su questo servizio

Traduzione automatica.

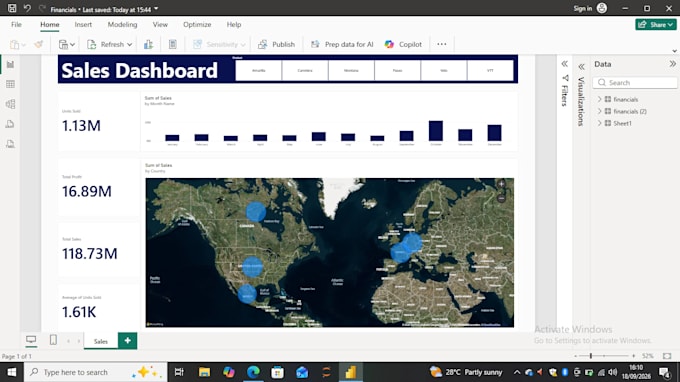
Ho creato un dashboard interattivo di vendita in Power BI usando dati di esempio per mostrare come i dati grezzi di business possano essere trasformati in insight chiari e utili.


Il dashboard offre una panoramica dei principali indicatori di performance di vendita, tra cui ricavi, tendenze di vendita, performance dei prodotti, performance regionali e altri metriche rilevanti. Visualizzazioni interattive e filtri rendono facile esplorare i dati e individuare pattern.


Strumenti usati: Power BI, Power Query


Scopri di più su Mistura Ganiyu

Mistura Ganiyu

Create interactive and dynamic dashboard using power bi, tableau and excel

  • DaNigeria
  • Membro daago 2025
  • Tempo di risposta medio1 ora
  • Lingue

    Inglese
Welcome! I help businesses unlock the true potential of their data through smart Excel tools and dynamic Power BI dashboards. From sales tracking and performance metrics to regional analytics and operational reporting, I design visually striking, easy-to-understand dashboards that simplify complex numbers. My goal is to save you time and help you make confident strategic decisions. Send me a message, and let’s discuss your project!

Traduzione automatica.

Il mio portfolio