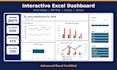
I will create an interactive excel dashboard with pivots and charts

R
roshanadepu
R
roshanadepu
roshan
Alcune informazioni sono riportate in lingua inglese.

Informazioni su questo servizio

Do you have raw data but no clear insights? I will turn it into a clean, interactive Excel dashboard that shows your numbers at a glance.

What you get

  • Data cleaning and preparation (duplicates, formats, blanks)
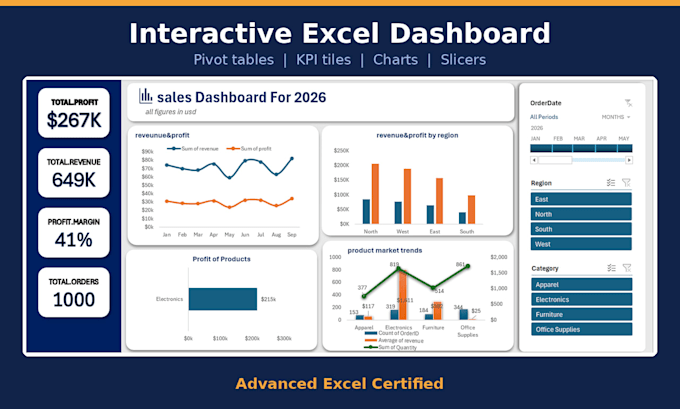
  • Pivot tables by region, category, product or month
  • KPI tiles (revenue, profit, margin, orders)
  • Charts and slicers so you can filter in one click
  • A short summary of key findings

Why work with me

  • Advanced Excel certified
  • Careful attention to accuracy and clear communication
  • Your data stays confidential

What I need from you

Your data file (Excel or CSV) and the KPIs you care about.

Please message me before ordering so we can confirm your requirements

Scopri di più su roshan

roshan

Excel Dashboard And Data Analysis Expert

  • DaIndia
  • Membro daott 2026
  • Tempo di risposta medio4 ore
  • Lingue

    Telugu, Inglese
Hi, I’m Roshan, a B.Com (Computer Application) graduate from Hyderabad, India, specialising in Excel data analysis and dashboards. I’m Advanced Excel certified and have built sales analytics dashboards using pivot tables, KPIs and slicers. I also have HR and recruitment support experience, so I can help with candidate data and records. I focus on accuracy, clear communication and on-time delivery. Message me with your data and I’ll suggest the best way to present it.

Tag correlati