Sfoglia categorie
Esplora
Fiverr Pro
Italiano
$
USD
Sviluppatore Web, sviluppatore Python, MERN Stack, esperto UML, analista dati
Livello 1
Ha soddisfatto determinati criteri di prestazione e mostra un forte potenziale nel marketplace.
Offro servizi professionali di analisi dei dati, visualizzazione dei dati e machine learning usando Python. Che tu abbia bisogno di un'analisi dettagliata dei dati o di mostrare i tuoi risultati con grafici chiari, sono qui per aiutarti. Utilizzo librerie Python come Pandas e NumPy per condurre analisi approfondite su misura per le tue esigenze. Dallo studio delle tendenze e l'identificazione di correlazioni al calcolo di metriche chiave, il mio approccio ti garantisce di ottenere il massimo dai tuoi dati.
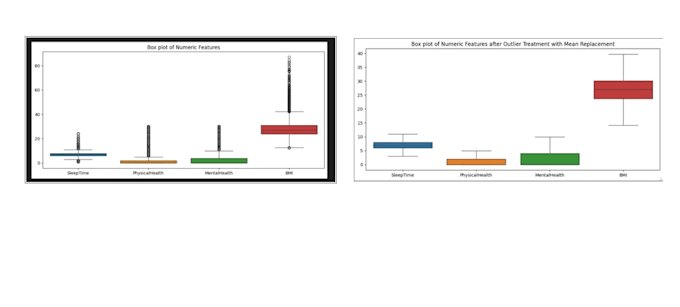
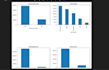
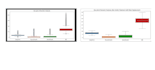
Per la visualizzazione dei dati, creo grafici e diagrammi visivamente coinvolgenti usando strumenti come Matplotlib, Seaborn e Plotly. Sono specializzato in grafici a barre, scatter plot, istogrammi e dashboard interattivi, offrendo una vista in tempo reale dei tuoi dati. Il mio obiettivo è rendere accessibili approfondimenti complessi attraverso una visualizzazione dei dati efficace.
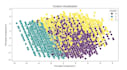
Inoltre, posso implementare modelli di machine learning per aiutarti a prevedere tendenze, classificare dati e ottenere insight pratici. Che si tratti di analisi dei dati, visualizzazione o integrazione di machine learning, trasformo i tuoi dati in risultati significativi, sfruttando sempre la potenza completa di Python.
Collaboriamo per trasformare i tuoi dati con analisi esperte, visualizzazioni coinvolgenti e machine learning innovativo.
Traduzione automatica.
Quali formati di dati accetti per analisi e visualizzazione?
Posso lavorare con vari formati di dati, tra cui CSV, Excel, JSON e database come MySQL e SQLite. Se i tuoi dati sono in un formato diverso, condividi i dettagli e ti aiuterò a convertirli in un formato compatibile.
Come garantisci l'accuratezza e la qualità dell'analisi dei dati?
Seguo un approccio strutturato che include pulizia dei dati, analisi esplorativa (EDA) e l'uso di modelli statistici e di machine learning appropriati. Validio i risultati con controlli incrociati e fornisco report trasparenti sui miei risultati.
Che tipi di visualizzazioni puoi creare?
Posso creare una vasta gamma di visualizzazioni, tra cui grafici a barre, linee, scatter plot, grafici a torta, istogrammi, heat map e dashboard interattivi usando strumenti come Matplotlib, Seaborn, Plotly e Tableau. Fammi sapere le tue preferenze specifiche!
| (6) | ||
| (0) | ||
| (0) | ||
| (0) | ||
| (0) |
pierrotjanson

Belgio
Very fast work
Fino a 50 USD
$
2 giorni
Tempo
pierrotjanson
Belgio
Good as always
Fino a 50 USD
$
1 giorno
Tempo
pierrotjanson
Belgio
Good as always
Fino a 50 USD
$
1 giorno
Tempo
pierrotjanson
Belgio
very good work
Fino a 50 USD
$
1 giorno
Tempo
pierrotjanson
Belgio
Very fast work
Fino a 50 USD
$
4 giorni
Tempo
| (6) | ||
| (0) | ||
| (0) | ||
| (0) | ||
| (0) |
pierrotjanson
Belgio
Very fast work
Fino a 50 USD
$
2 giorni
Tempo
pierrotjanson
Belgio
Good as always
Fino a 50 USD
$
1 giorno
Tempo
pierrotjanson
Belgio
Good as always
Fino a 50 USD
$
1 giorno
Tempo
pierrotjanson
Belgio
very good work
Fino a 50 USD
$
1 giorno
Tempo
pierrotjanson
Belgio
Very fast work
Fino a 50 USD
$
4 giorni
Tempo