Creerò grafici semplici e avanzati in python, matplotlib e seaborn

T
tanya_lomskaya
T
tanya_lomskaya
Tanya L
Alcune informazioni sono state tradotte automaticamente.

Informazioni su questo servizio

Traduzione automatica.

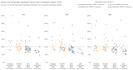
Realizzerò sia grafici semplici che avanzati con Matplotlib e Seaborn, pronti per la stampa in formato PDF su richiesta.


Il tuo input:

Dati in qualsiasi formato (.csv, .xlsx, .json, sql, ecc.)


Il mio output:

Grafici statici in formato .png, .jpg, .pdf;

Jupyter Notebook con tutti i grafici e i codici.


Tipi di grafico -- qualsiasi (Scatterplot, Istogramma, Box Plot, Heatmap, Bar Chart, Pie Chart, Gantt Chart, Violin Plot, Word Cloud, ecc.). Altri tipi possibili qui: https://matplotlib.org/3.1.1/gallery/index.html


Scopri di più su Tanya L

Tanya L

Data Analyst with expertise in Tableau and Python

  • DaGeorgia
  • Membro dagiu 2026
  • Lingue

    Russo, Inglese
I am a data analyst with a passion for transforming complex data into structured and actionable visual stories. I help with: ⬩ Dashboard design (Tableau, Power BI); ⬩ UX-focused dashboard (re)design; ⬩ Dashboard conversion: Tableau to Power BI and back; ⬩ Exploratory and statistical data analysis (Python, SQL); ⬩ Data extraction, cleaning, and transformation; ⬩ Python visualization (Matplotlib, Seaborn, Plotly). I love working on new projects and finding effective solutions to complex business problems. If this resonates with you, please contact me—I'm always happy to discuss collaboration.

Traduzione automatica.