Sfoglia categorie
Esplora
Fiverr Pro
Italiano
$
USD

"I will do data analysis and visualization in excel"
Competenze
Consulta i miei servizi
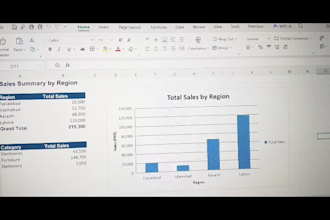


Data Anlysis
Self-Employed / Freelancer • Part time
Jul 2024 - Present • 2 yrs 3 mos
I got into data analysis almost by accident. I was working with spreadsheets for something completely unrelated, and I kept running into the same problem — the data was there, but nobody could actually make sense of it. Numbers scattered across different sheets, half-finished formulas, columns that didn't match up. I remember spending hours just trying to figure out what a dataset was even trying to tell me, and somewhere in that process, I realized I actually enjoyed it. Not the mess itself, but the part where everything finally clicked into place and suddenly the data made sense. From there, I started teaching myself properly. Instead of just watching tutorials and moving on, I made it a point to actually sit with real datasets — the messier, the better. I'd download random public datasets, sometimes stuff about sales, sometimes population data, sometimes just random numbers I found online, and I'd practice cleaning them up, organizing them, and figuring out what story they were telling. A lot of it was trial and error. I'd get stuck, look up what I was doing wrong, fix it, and move on. That process taught me more than any course could have, honestly. Over time, I got more comfortable handling different types of problems — not just cleaning up messy spreadsheets, but actually digging into the data to find patterns, building visuals that made those patterns obvious at a glance, and putting together reports that didn't require a technical background to understand. That last part matters a lot to me. I've seen plenty of dashboards and reports that look impressive but leave the person reading them more confused than before. I never wanted to be the person creating those. My goal has always been to make sure that whoever I'm working with can look at what I've done and immediately understand what it means for them. What I bring to a project isn't years of corporate experience — I'm upfront about that. What I do bring is genuine curiosity about the data, patience to
