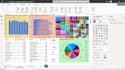
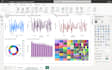
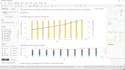
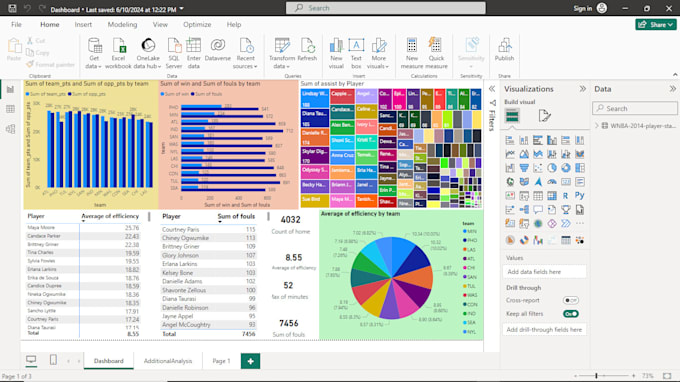
Farò visualizzazione dei dati usando tableau e powerbi

W
wyckliff
W
wyckliff
Dr. W. Herberts
Alcune informazioni sono state tradotte automaticamente.

Informazioni su questo servizio

Traduzione automatica.

Visualizzazione dei dati con Tableau e Power BI, per mostrare fogli, storie e dashboard. I visual includono grafici a linee, a barre, istogrammi, mappe, diagrammi ad albero, grafici a torta e molti altri disponibili in Tableau e Power BI

Scopri di più su Dr. W. Herberts

Dr. W. Herberts

Engineering design, FEA, CFD using SolidWorks, ANSYS, Inventor Pro

4,3(1)
  • DaKenya
  • Membro daapr 2020
  • Tempo di risposta medio1 ora
  • Ultima consegna1 mese
  • Lingue

    Inglese
I am an Industrial engineer with design skills in Inventor Pro, SolidWorks, and ANSYS Workbench. I can perform conceptual design and FEA & CFD tasks and complete them efficiently. I have 7 years' technical experience in engineering research and design. Also, I can use a wide range of statistical tools to conduct data analysis. The software I can use include SPSS, EViews, JASP, JMP, STATA, Power BI, Ms Excel, and Tableau. I can handle project scheduling and resource allocation tasks: Gantt, WBS, Critical Path using MS Project, Project Libre, and flow charts using Ms Visio and Draw.io

Traduzione automatica.

Il mio portfolio